Excelで新しいデータを入力した後、チャートを自動更新するにはどうすればよいですか?
たとえば、毎日の売上データを視覚的に追跡するためにExcelでチャートを作成し、新しい売上が記録されるたびにこのデータを定期的に更新しているとします。通常、範囲内のデータを挿入または修正するたびに、チャートのデータ範囲を手動で調整して、最新の数値が表示されるようにする必要があります。この手動プロセスは、特に大規模なデータセットや頻繁に変更される情報がある場合、繰り返しが多く、エラーが発生しやすくなります。幸いなことに、新しいデータが追加されたときにチャートを自動的に更新するための実用的な方法があり、ダッシュボードやレポートを常に最新の状態に保つのに役立ちます。
Excelでこの自動チャート更新を達成するにはいくつかの方法があります。それぞれ、異なるExcelバージョンやデータレイアウトに適しています。以下で説明するソリューションには、データをExcelテーブルに変換すること、名前付き範囲を使用した動的数式、そして特に複雑またはカスタム要件に有用なVBAマクロの適用が含まれています。
新しいデータを入力した後にテーブルを作成してチャートを自動更新する
新しいデータを入力した後に動的数式を使用してチャートを自動更新する
新しいデータを入力した後にVBAコードを使用してチャートを自動更新する
 新しいデータを入力した後にテーブルを作成してチャートを自動更新する
連続したデータ範囲と対応する列チャートがある場合、データ範囲をExcelテーブルに変換することで、新しい情報を追加するたびにチャートが即座に更新されるようにすることができます。この方法はExcel2007以降のバージョンで利用可能で、拡張するデータセットの管理が非常に簡単になります。主な利点は、テーブルを参照しているチャートが、テーブルに追加された新しい行を自動的に含むことです。以下はそのやり方です:

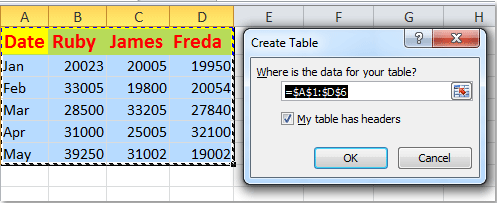
1. ヘッダーと日次の値を含む既存のデータ範囲を選択します。次に、「挿入」タブに移動して「テーブル」をクリックします。以下のスクリーンショットをご覧ください:

2. 「テーブルの作成」ダイアログボックスで、データにヘッダーが含まれている場合、「テーブルにヘッダーがある」オプションがチェックされていることを確認してください。その後、「OK」をクリックします。(範囲にヘッダーがない場合は、このボックスのチェックを外してください。)

3. 選択したデータ範囲は、構造化されたExcelテーブルとしてフォーマットされます。以下の画像のように、テーブルスタイルの書式が自動的に適用されます:

4. これで、テーブルの最後の行の直下に新しい行を追加するたびに(例:6月のデータを入力する場合)、テーブルとリンクされたチャートが自動的に拡張され、余分な手順なしで最新のデータが表示されます。参考のために、以下の例をご覧ください:

注意事項と実用的なヒント:
1. 新しく入力されたデータは直接隣接している必要があります。つまり、新しいデータと既存のデータの間に空の行や列があってはいけません。さもなければ、テーブル(およびチャート)は拡張を認識しません。
2. テーブル内であればどこでも新しい行を挿入でき、チャートは自動的に更新されます。これは過去の記録を更新する際にも役立ちます。
3. チャートが期待通りに更新されない場合は、チャートの元データ範囲がテーブルではなく静的な範囲を参照していないか確認してください。

Kutools AIでExcelの魔法を解き放つ
- スマート実行: セル操作、データ分析、グラフ作成を簡単なコマンドで行います。
- カスタム数式: ワークフローを合理化するための独自の数式を生成します。
- VBAコーディング: 簡単にVBAコードを作成し実装します。
- 数式の解釈: 複雑な数式を簡単に理解できます。
- テキスト翻訳: スプレッドシート内の言語障壁を取り除きます。
 新しいデータを入力した後に動的数式を使用してチャートを自動更新する
データをExcelテーブルに変換したくない場合は、数式によって提供される動的名前付き範囲を使用できます。この方法では、OFFSET関数とCOUNTA関数を利用して、現在存在するデータ量に応じて自動的にサイズが変更される範囲を定義します。このアプローチは、データ構造が固定されているが、エントリーが定期的に追加または削除される場合に特に便利です。以下の具体的な手順をご覧ください:

1. 各データ列に対応する動的名前付き範囲を定義することから始めます。「数式」タブに移動して「名前の定義」をクリックします。
2. 「新しい名前」ダイアログで、適切な名前(例:日付列の場合「Date」)を入力し、スコープとして正しいワークシートを選択し、「参照先」フィールドに動的数式を入力します。例えば:=OFFSET($A$2,0,0,COUNTA($A:$A)-1)。参考のために、以下のスクリーンショットをご覧ください:

3. 「OK」をクリックして保存します。各系列またはデータ列に対して手順を繰り返します。使用する数式は次のようになります:
- 列B: Ruby: =OFFSET($B$2,0,0,COUNTA($B:$B)-1);
- 列C: James: =OFFSET($C$2,0,0,COUNTA($C:$C)-1);
- 列D: Freda: =OFFSET($D$2,0,0,COUNTA($D:$D)-1)
これらの動的名前付き範囲により、各列に新しいデータが追加されると、範囲が自動的に拡大または縮小します。OFFSET数式は最初のデータ行から始まり、COUNTAは指定された列内の空白ではないセルの総数に応じて範囲サイズを調整しますのでご注意ください。
4. すべての名前付き範囲を定義したら、リンクされたチャートの列のいずれかを右クリックし、コンテキストメニューから「データの選択」を選択します。

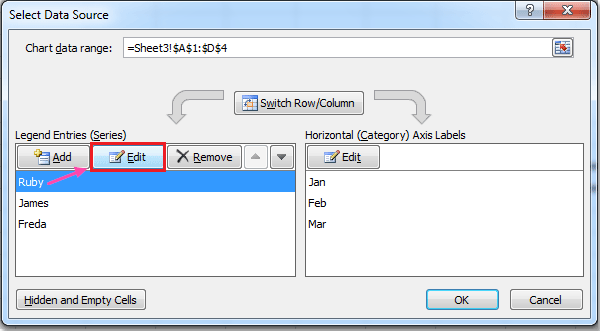
5. 「データソースの選択」ダイアログボックスで、関連する系列(例:Ruby)を選択し、「編集」をクリックして、該当する動的範囲を「系列の値」として入力します(例:=Sheet3!Ruby)。以下をご覧ください:
 |
 |
6. 追加の系列についても同様の操作を繰り返し、該当する動的名前付き範囲を参照します:
- James: 系列の値: =Sheet3!James;
- Freda: 系列の値: =Sheet3!Freda
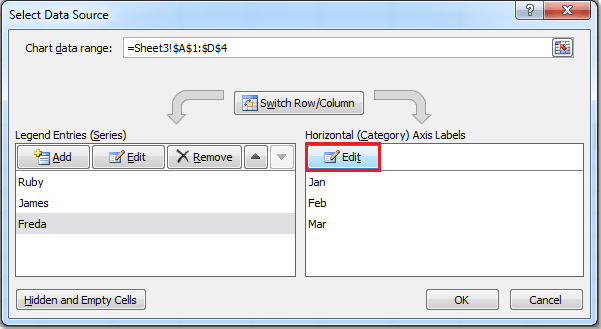
7. 水平(カテゴリ)軸ラベルについては、「水平(カテゴリ)軸ラベル」の下にある「編集」をクリックし、日付列の動的範囲名を入力します。
 |
 |
8. 「OK」をクリックして確認し、すべてのダイアログを終了します。これで、ワークシートに新しいデータエントリを追加すると、チャートは最新のデータポイントを反映して自動的に更新されます。

- 1. データは列内の連続したセルに入力する必要があります。動的数式は行間のギャップを考慮しないため、行をスキップすると自動拡張が意図通りに動作しない可能性があります。
- 2. このアプローチでは、新しいヘッダーが追加された場合、追加の系列や列を取得できません。新しい名前付き範囲を作成し、チャートのデータソースをそれに応じて更新する必要があります。
- 3. 動的範囲が拡張されない場合は、COUNTA範囲を再確認し、想定しているデータの下に不要なエントリーがないことを確認してください。
- 4. ワークシート名やセル位置を変更した場合は、動的動作を維持するために名前付き範囲の参照を更新してください。
 新しいデータを入力した後にVBAコードを使用してチャートを自動更新する
非連続データの処理、完全に新しいデータ系列の自動検出、または複数のチャートを同時に更新するなど、高度な要件がある場合、VBAマクロはより柔軟性と自動化を提供できます。データの変更に応答する短いマクロを書き込むことで、チャートのデータソースを更新するプロセスを自動化し、以前の方法では直接カバーできないより複雑なシナリオに対応できます。
このソリューションは、データが分散している場合や規則的なブロックにない場合、または新しい系列や列を定期的にチャートに追加する場合にお勧めです。以下の手順に従って設定してください:
1. まず、通常どおりにチャートを挿入します。
2. Alt + F11キーを押してVBAエディターを開きます。
3. VBAエディターで、「挿入」>「モジュール」をクリックして新しいコードモジュールを挿入します。次に、以下のマクロコードをモジュールウィンドウに入力します:
Sub AutoUpdateChartData()
    Dim ws As Worksheet
    Dim chrt As ChartObject
    Dim lastRow As Long

    On Error Resume Next
    xTitleId = "KutoolsforExcel"

    Set ws = ActiveSheet
    Set chrt = ws.ChartObjects(1) ' Modify if you have more than 1 chart on the sheet

    ' Find the last row of data in column A (assume your data starts from A1, adjust as needed)
    lastRow = ws.Cells(ws.Rows.Count, "A").End(xlUp).Row

    ' Set the data range for the chart dynamically (Modify range as per your data location)
    chrt.Chart.SetSourceData Source:=ws.Range("A1:D" & lastRow)

    On Error GoTo 0
End Sub3. マクロを実行するには、「実行」 ボタンをクリックします。これで、チャートは最終の埋められた行まで、現在の全データを即座に反映して更新されます。
さらに自動化を強化するために、このマクロを新しいデータが入力されるたびに自動的にトリガーされるように設定できます。
これを適用するには、ワークシートタブを右クリックして「コードの表示」を選択し、上記のコードをワークシートモジュールに貼り付けます。これで、シートに変更を加えるたびにマクロが実行され、チャートが常に最新の状態に保たれます。
Private Sub Worksheet_Change(ByVal Target As Range)
    On Error Resume Next
    xTitleId = "KutoolsforExcel"
    Call AutoUpdateChartData
End Sub
ヒントと注意事項:
- データ範囲(例:"A1:D" & 最後の行)は、実際のデータセットの場所と構造に合わせて修正する必要があります。非連続範囲の場合は、コード内で範囲文字列を直接カスタマイズすることを検討してください。
- 複数のチャートがある場合、正しいチャートを参照するためにChartObjects(1)を調整する必要があるかもしれません。あるいは、ワークシート上のすべてのChartObjectsを必要に応じてループさせる必要があります。
- このVBAソリューションは、動的で複雑なデータセットに対して最大限の柔軟性を提供しますが、マクロを有効にし、ファイルをマクロ対応のワークブック(.xlsm)として保存する必要があります。
- チャートが期待通りに更新されない場合は、マクロ内の元データ範囲が実際のデータブロックと一致しているか確認し、Excel環境でマクロが有効になっていることを確実にしてください。
関連記事:
Excelでチャートに水平平均線を追加するにはどうすればよいですか?
Excelでコンビネーションチャートを作成し、二次軸を追加するにはどうすればよいですか?
最高のオフィス業務効率化ツール
| 🤖 | Kutools AI Aide:データ分析を革新します。主な機能:Intelligent Execution|コード生成|カスタム数式の作成|データの分析とグラフの生成|Kutools Functionsの呼び出し…… |
| 人気の機能:重複の検索・ハイライト・重複をマーキング|空白行を削除|データを失わずに列またはセルを統合|丸める…… | |
| スーパーLOOKUP:複数条件でのVLookup|複数値でのVLookup|複数シートの検索|ファジーマッチ…… | |
| 高度なドロップダウンリスト:ドロップダウンリストを素早く作成|連動ドロップダウンリスト|複数選択ドロップダウンリスト…… | |
| 列マネージャー:指定した数の列を追加 |列の移動 |非表示列の表示/非表示の切替| 範囲&列の比較…… | |
| 注目の機能:グリッドフォーカス|デザインビュー|強化された数式バー|ワークブック&ワークシートの管理|オートテキスト ライブラリ|日付ピッカー|データの統合 |セルの暗号化/復号化|リストで電子メールを送信|スーパーフィルター|特殊フィルタ(太字/斜体/取り消し線などをフィルター)…… | |
| トップ15ツールセット:12 種類のテキストツール(テキストの追加、特定の文字を削除など)|50種類以上のグラフ(ガントチャートなど)|40種類以上の便利な数式(誕生日に基づいて年齢を計算するなど)|19 種類の挿入ツール(QRコードの挿入、パスから画像の挿入など)|12 種類の変換ツール(単語に変換する、通貨変換など)|7種の統合&分割ツール(高度な行のマージ、セルの分割など)|… その他多数 |
Kutools for ExcelでExcelスキルを強化し、これまでにない効率を体感しましょう。 Kutools for Excelは300以上の高度な機能で生産性向上と保存時間を実現します。最も必要な機能はこちらをクリック...
Office TabでOfficeにタブインターフェースを追加し、作業をもっと簡単に
- Word、Excel、PowerPointでタブによる編集・閲覧を実現。
- 新しいウィンドウを開かず、同じウィンドウの新しいタブで複数のドキュメントを開いたり作成できます。
- 生産性が50%向上し、毎日のマウスクリック数を何百回も削減!
全てのKutoolsアドインを一つのインストーラーで
Kutools for Officeスイートは、Excel、Word、Outlook、PowerPoint用アドインとOffice Tab Proをまとめて提供。Officeアプリを横断して働くチームに最適です。
- オールインワンスイート — Excel、Word、Outlook、PowerPoint用アドインとOffice Tab Proが含まれます
- 1つのインストーラー・1つのライセンス —— 数分でセットアップ完了(MSI対応)
- 一括管理でより効率的 —— Officeアプリ間で快適な生産性を発揮
- 30日間フル機能お試し —— 登録やクレジットカード不要
- コストパフォーマンス最適 —— 個別購入よりお得