Excelのチャートでゼロ値のデータラベルを非表示にするには?
Excelでチャートを作成する際、データラベルを追加するとデータポイントが明確になり、視聴者は直接的に値にアクセスできるようになります。しかし、チャート化されたデータにゼロが含まれている場合、Excelはこれらのゼロをデータラベルとして表示することが多く、混乱を招いたり、チャートの視覚的な魅力を低下させる可能性があります。ビジネス、学術、またはレポート作成のシナリオでは、重要な値のみを表示するためにゼロ値のデータラベルを非表示にすることが一般的です。
幸いなことに、Excelにはゼロ値のデータラベルを非表示にするためのいくつかの実用的な方法があります。それぞれが異なるニーズやワークフローに適しています。このチュートリアルでは、組み込みの書式設定、数式ベースの方法、さらにはVBAを使った自動化など、一般的なアプローチをまとめています。ステップバイステップの手順と役立つヒントを読んで、チャートに本当に必要なデータだけを表示するようにしましょう。
- カスタム数字形式を用いてチャート内のゼロ値データラベルを非表示にする
- Excelの数式 - ソースデータ内でIF数式を使用してゼロを非表示にする
- VBAコード - コードでゼロ値のデータラベルを自動的に非表示にする
カスタム数字形式を用いてチャート内のゼロ値データラベルを非表示にする
元のデータを変更せずにチャート内のゼロ値データラベルを非表示にしたい場合、最も速い方法の一つはカスタム数字形式をデータラベルに適用することです。この方法は、基盤となるデータ(ゼロを含む)を保持しつつ、単にチャート上でのゼロ値の表示を避けたい場合に特に役立ちます。
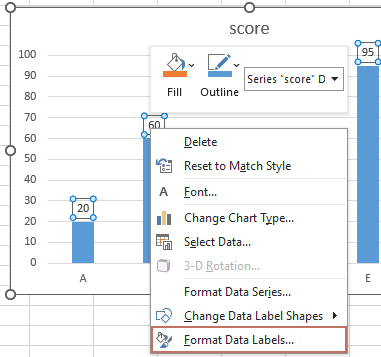
1. まず、必要に応じてチャートにデータラベルを追加します。その後、任意のデータラベルを右クリックし、コンテキストメニューから「データラベルの書式設定」を選択します。スクリーンショットをご覧ください:

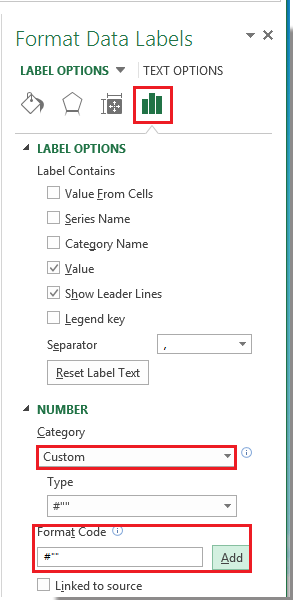
2. 「データラベルの書式設定」ダイアログで、左ペインの「数字」をクリックします。次に、「カテゴリ」リストボックスから「カスタム」を選択します。「書式コード」テキストボックスに「#""」というカスタムフォーマットコードを入力し、「追加」をクリックしてタイプリストに保存します。スクリーンショットをご覧ください:

注意: Excel 2013以降では、任意のデータラベルを右クリックして「データラベルの書式設定」を選択した後、フォーマットペインで「数字」を展開し、「カスタム」を選択し、「書式コード」として「#""」を入力し、「追加」をクリックします。

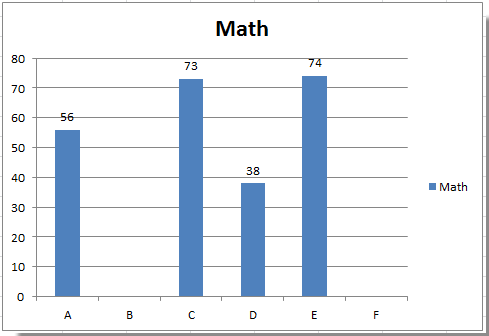
3. ダイアログを閉じるには「閉じる」をクリックします。これで、ゼロ値を持つデータラベルはチャート表示から隠され、非ゼロ値のみが表示されます。

ヒント: ゼロ値データラベルを復元するには、「データラベルの書式設定」ダイアログに戻り、「数字」→「カスタム」を選択し、「#,##0;-#,##0」などの標準的な数字形式を選択してください。
この解決策は、迅速な視覚的な修正が必要な場合に特に効果的であり、ほとんどの数値ベースのチャート(列、棒、折れ線など)に適用できます。ただし、データソースが定期的に数式や変動するゼロ値で更新される場合は、以下で説明する数式ベースまたは自動化された解決策を検討することをお勧めします。
警告: カスタム数字形式はチャート上でゼロを視覚的に非表示にしますが、実際の値は背景およびソースデータではゼロのままです。
Excelの数式 - ソースデータ内でIF数式を使ってチャートのゼロを非表示にする
Excelチャート上のゼロ値データラベルが表示されないようにするもう一つの実用的な方法は、IF数式を使用してソースデータを変更することです。この方法では、チャートデータ範囲のゼロ値を空白セルに置き換えることで、Excelのチャートエンジンがそれらのポイントをプロットしたりラベル付けしたりしないようにします。このアプローチは、チャートが動的なデータ範囲や数式を参照しており、追加の書式設定なしにどのデータを表示するかを制御したい場合に特に有用です。
適用可能なシナリオ: ソースデータを操作できる場合(またはチャート用の補助列を作成できる場合)、そしてチャートラベルやチャートシリーズ自体からゼロ値を完全に除外したい場合にこの解決策を使用してください。
利点: 単純で効果的、ゼロがチャートのデータポイントとそのラベルの両方から省略されることが保証されます。
欠点: 元のデータセットを変更したくない場合は、既存のデータを調整するか、補助列を追加する必要があります。
この解決策を実装するには:
1. 新しい補助列または既存のデータ範囲内(例えば、元の値がB列にあると仮定し、セルB2から始まる場合)に、対応する補助列のセル(例えば、C2)に次の数式を入力します:
=IF(A1=0,"",A1)この数式は、セルC2を確認します。値がゼロの場合、空白セルを返します。それ以外の場合は、元の値を返します。
2. 数式を確定するには「Enter」キーを押します。次に、必要に応じて数式を元のデータ全体にコピーします。数式セルを選択し、フィルハンドルをドラッグするか、Ctrl+C/Ctrl+Vを使用します。
3. チャートのデータ範囲を、この新しい補助列(例: C 列)を参照するように更新します。これにより、プロットされた系列が調整された値を反映します。
- チャート内の既存のデータラベルを右クリックし、「データラベルの書式設定」を選択します。

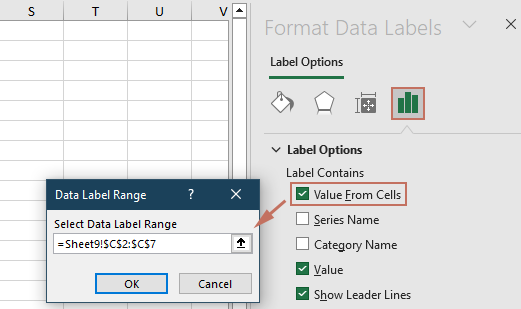
- 「ラベルオプション」の下で、「セルからの値」を選択します。ダイアログが表示されますので、補助列の範囲を選択して「OK」をクリックします。

- 「値」などの他のラベルオプションのチェックを外します。
これで、Excelはゼロ値のデータラベルを表示しなくなります。これは、チャートデータ範囲のセルが実際に空白(ゼロではない)だからです。念のため、チャート設定で空白がゼロとして解釈されていないことを確認してください(例:折れ線グラフや散布図の場合は、「データの選択」→「非表示および空のセル設定」で確認)。
エラーメモ: 数式列に「#VALUE!」などのエラーが含まれている場合、それらのポイントもチャート上に省略されるか、エラーラベルが表示されることがあります。すべての行で正しく動作することを確認してください。
VBAコード - チャート内のゼロ値データラベルを自動的に非表示にする
大規模なデータセット、頻繁に更新されるチャート、または繰り返しのレポートで、VBAを使用すると、Excelチャートからゼロ値データラベルを自動的に非表示または削除する便利で効率的な方法を提供します。VBAソリューションは、プロセスを自動化したり、複数のチャートを一度に処理したい場合に最適です。
適用可能なシナリオ: このアプローチは、マクロを実行することに慣れているユーザー、または複数のExcelワークブックで複雑かつ繰り返しの多いチャートタスクを管理する場合に最適です。
利点: ゼロ値データラベルの非表示を自動化し、時間を節約し、手動操作によるミスの機会を減らします。チャートデータが変更された場合や、頻繁に更新されるダッシュボードを作成する際にも機能します。
欠点: マクロを有効にする必要があり、基本的なVBA手順の理解が必要です。VBAによって行われた変更は、データまたはチャートシリーズが実行後に更新された場合、再読み込みが必要になる場合があります。
このVBAソリューションの使用方法:
1. Excelのリボンで、[開発] → [Visual Basic] をクリックしてVBAエディタを開きます。VBAウィンドウで、[挿入] → [モジュール] をクリックし、以下のコードを新しく作成されたモジュールに貼り付けます:
Sub HideZeroDataLabels()
'Updated by extendoffice 2025/7/11
    Dim cht As Chart
    Dim s As Series
    Dim pt As Point
    Dim xTitleId As String

    On Error Resume Next
    xTitleId = "KutoolsforExcel"

    Set cht = Application.ActiveChart
    If cht Is Nothing Then
        MsgBox "Please activate the chart from which you want to hide zero data labels.", vbExclamation, xTitleId
        Exit Sub
    End If

    For Each s In cht.SeriesCollection
        For Each pt In s.Points
            If pt.HasDataLabel Then
                If pt.DataLabel.Text = "0" Or pt.DataLabel.Text = "0%" Then
                    pt.DataLabel.Delete
                End If
            End If
        Next pt
    Next s
End Sub2. ワークシートに戻り、ゼロ値データラベルを非表示にしたいチャートをアクティブにします(チャートの枠を1回クリックします)。
3. VBAエディタに戻り、「 ![]() 実行 」ボタンをクリックするか(または F5を押す)してマクロを実行します。このマクロは、すべてのチャートシリーズをループ処理し、ゼロ値のラベルを自動的に非表示にしますが、他のデータラベルには影響を与えません。
実行 」ボタンをクリックするか(または F5を押す)してマクロを実行します。このマクロは、すべてのチャートシリーズをループ処理し、ゼロ値のラベルを自動的に非表示にしますが、他のデータラベルには影響を与えません。
実践的なヒント: チャートに複数のデータシリーズがある場合、マクロは各シリーズを個別に処理します。また、繰り返し使用しやすくするために、マクロをカスタムボタンに割り当てることもできます。
エラーメモ: コードを実行する前にマクロが有効になっていることを確認し、処理したいチャートが現在アクティブであることを確認してください。そうしないと、マクロが警告を促します。
関連記事:
最高のオフィス業務効率化ツール
| 🤖 | Kutools AI Aide:データ分析を革新します。主な機能:Intelligent Execution|コード生成|カスタム数式の作成|データの分析とグラフの生成|Kutools Functionsの呼び出し…… |
| 人気の機能:重複の検索・ハイライト・重複をマーキング|空白行を削除|データを失わずに列またはセルを統合|丸める…… | |
| スーパーLOOKUP:複数条件でのVLookup|複数値でのVLookup|複数シートの検索|ファジーマッチ…… | |
| 高度なドロップダウンリスト:ドロップダウンリストを素早く作成|連動ドロップダウンリスト|複数選択ドロップダウンリスト…… | |
| 列マネージャー:指定した数の列を追加 |列の移動 |非表示列の表示/非表示の切替| 範囲&列の比較…… | |
| 注目の機能:グリッドフォーカス|デザインビュー|強化された数式バー|ワークブック&ワークシートの管理|オートテキスト ライブラリ|日付ピッカー|データの統合 |セルの暗号化/復号化|リストで電子メールを送信|スーパーフィルター|特殊フィルタ(太字/斜体/取り消し線などをフィルター)…… | |
| トップ15ツールセット:12 種類のテキストツール(テキストの追加、特定の文字を削除など)|50種類以上のグラフ(ガントチャートなど)|40種類以上の便利な数式(誕生日に基づいて年齢を計算するなど)|19 種類の挿入ツール(QRコードの挿入、パスから画像の挿入など)|12 種類の変換ツール(単語に変換する、通貨変換など)|7種の統合&分割ツール(高度な行のマージ、セルの分割など)|… その他多数 |
Kutools for ExcelでExcelスキルを強化し、これまでにない効率を体感しましょう。 Kutools for Excelは300以上の高度な機能で生産性向上と保存時間を実現します。最も必要な機能はこちらをクリック...
Office TabでOfficeにタブインターフェースを追加し、作業をもっと簡単に
- Word、Excel、PowerPointでタブによる編集・閲覧を実現。
- 新しいウィンドウを開かず、同じウィンドウの新しいタブで複数のドキュメントを開いたり作成できます。
- 生産性が50%向上し、毎日のマウスクリック数を何百回も削減!
全てのKutoolsアドインを一つのインストーラーで
Kutools for Officeスイートは、Excel、Word、Outlook、PowerPoint用アドインとOffice Tab Proをまとめて提供。Officeアプリを横断して働くチームに最適です。
- オールインワンスイート — Excel、Word、Outlook、PowerPoint用アドインとOffice Tab Proが含まれます
- 1つのインストーラー・1つのライセンス —— 数分でセットアップ完了(MSI対応)
- 一括管理でより効率的 —— Officeアプリ間で快適な生産性を発揮
- 30日間フル機能お試し —— 登録やクレジットカード不要
- コストパフォーマンス最適 —— 個別購入よりお得

