メインコンテンツへスキップ

Excelで最高値または最低値を選択するにはどうすればよいですか?

スプレッドシートまたは選択範囲(最高売上高、最低価格など)で最高値または最低値を見つけて選択する必要がある場合があります。どのように対処しますか? この記事では、選択範囲の最高値と最低値を見つけて選択するためのトリッキーなヒントをいくつか紹介します。


数式を使用して、選択範囲の最高値または最低値を見つけます


範囲内で最大または最小の数値を取得するには:

結果を取得する空白のセルに次の数式を入力するだけです。

Get the largest value: =Max (B2:F10)
Get the smallest value: =Min (B2:F10)

そして、 入力します 範囲内の最大または最小の数値を取得するためのキー。スクリーンショットを参照してください。


範囲内で最大3または最小3の数値を取得するには:

ワークシートから最大または最小の3つの数値を見つけたい場合があります。このセクションでは、この問題を解決するための数式を紹介します。次のようにしてください。

以下の数式をセルに入力してください。

Get the largest 3 values: =LARGE(B2:F10,1)&", "&LARGE(B2:F10,2)&", "&LARGE(B2:F10,3)
Get the smallest 3 values: =SMALL(B2:F10,1)&", "&SMALL(B2:F10,2)&", "&SMALL(B2:F10,3)

  • ヒント: 最大または最小の5つの数値を検索する場合は、&を使用して、次のようにLARGEまたはSMALL関数を結合する必要があります。
  • =LARGE(B2:F10,1)&", "&LARGE(B2:F10,2)&", "&LARGE(B2:F10,3)&","&LARGE(B2:F10,4) &","&LARGE(B2:F10,5)

ヒント:これらの式を覚えるのは難しすぎるが、 自動テキスト の特徴 Kutools for Excel、必要なすべての数式を保存し、いつでもどこでも好きなときに再利用できます。     クリックしてKutoolsfor Excelをダウンロードしてください!


条件付き書式を使用して、選択範囲の最高値または最低値を見つけて強調表示します

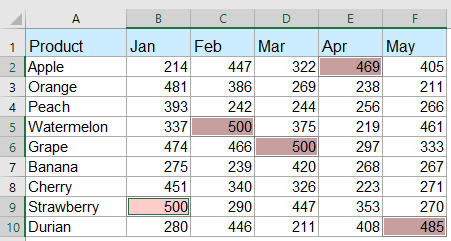
通常、 条件付き書式 この機能は、セルの範囲から最大または最小のn値を見つけて選択するのにも役立ちます。次のようにしてください。

1に設定します。 OK をクリックします。 ホーム > 条件付き書式 > トップ/ボトムルール > トップ10アイテム、スクリーンショットを参照してください:

2。 の中に トップ10アイテム ダイアログボックスで、検索する最大値の数を入力し、それらの形式をXNUMXつ選択すると、最大n個の値が強調表示されます。スクリーンショットを参照してください。

  • ヒント: 最小のn値を見つけて強調表示するには、クリックするだけです。 ホーム > 条件付き書式 > トップ/ボトムルール > ボトム10アイテム。

強力な機能を備えた選択で、最高値または最低値をすべて選択します

  Kutools for Excel's 最大値と最小値のセルを選択 最高値または最低値を見つけるだけでなく、それらすべてを選択して選択するのにも役立ちます。

ヒント:これを適用する 最大値と最小値のセルを選択 機能、まず、ダウンロードする必要があります Kutools for Excel、次に機能をすばやく簡単に適用します。

インストールした後 Kutools for Excel、次のようにしてください。

1. 使用する範囲を選択し、をクリックします クツール > 選択 > 最大値と最小値のセルを選択…、スクリーンショットを参照してください:

3。 の中に 最大値と最小値のセルを選択 ダイアログボックス:

  • (1.)検索するセルのタイプ(数式、値、またはその両方)を 覗く ボックス;
  • (2.)次に、 最大値 or 最小値 必要に応じて;
  • (3.)そして、ここで、最大または最小に基づいてスコープを指定してください。 セル.
  • (4.)次に、最初に一致するセルを選択する場合は、 最初のセルのみ オプションで、一致するすべてのセルを選択するには、 すべてのセル オプションを選択します。

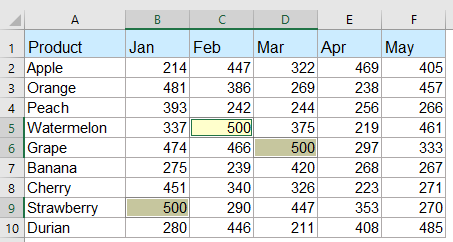
4。 そして、 OK、選択範囲内のすべての最高値または最低値が選択されます。次のスクリーンショットを参照してください。

最小値をすべて選択してください

最大値をすべて選択します

今すぐExcel用のKutoolsをダウンロードして無料トライアル!


強力な機能を使用して、各行または列で最大値または最小値を選択します

各行または列で最大値または最小値を見つけて選択する場合は、 Kutools for Excel また、あなたに恩恵を与えることができます、次のようにしてください:

1。 最大値または最小値を選択するデータ範囲を選択します。 次に、をクリックします クツール > 選択 > 最大値と最小値のセルを選択 この機能を有効にします。

2。 の中に 最大値と最小値のセルを選択 ダイアログボックスで、必要に応じて次の操作を設定します。

4。 次に、をクリックします Ok ボタンをクリックすると、各行または列のすべての最大値または最小値が一度に選択されます。スクリーンショットを参照してください。

各行の最大値

各列の最大値

今すぐExcel用のKutoolsをダウンロードして無料トライアル!


セルの範囲または各列と行で最大値または最小値を持つすべてのセルを選択または強調表示します

Kutools for Excel's 最大値と最小値を持つセルを選択します この機能を使用すると、必要に応じて、セルの範囲、各行、または各列からすべての最大値または最小値をすばやく選択または強調表示できます。 以下のデモをご覧ください。    クリックしてKutoolsfor Excelをダウンロードしてください!


より相対的な最大または最小値の記事:

  • Excelで重複することなくN番目に大きい値を見つけて取得する
  • Excelワークシートでは、Large関数を適用することにより、最大、XNUMX番目に大きい、またはn番目に大きい値を取得できます。 ただし、リストに重複する値がある場合、この関数はn番目に大きい値を抽出するときに重複をスキップしません。 この場合、Excelで重複せずにn番目に大きい値を取得するにはどうすればよいですか?
  • ExcelでN番目に大きい/小さい一意の値を見つける
  • いくつかの重複を含む数値のリストがある場合、これらの数値の中でn番目に大きい値または小さい値を取得するために、通常のLargeおよびSmall関数は重複を含む結果を返します。 Excelでの重複を無視して、n番目に大きい値または最小の値を返すにはどうすればよいですか?
  • 各行または列の最大/最小値を強調表示
  • 複数の列と行のデータがある場合、各行または列の最大値または最小値をどのように強調表示できますか? 各行または列で値をXNUMXつずつ識別するのは面倒です。 この場合、Excelの条件付き書式機能が役立ちます。 詳細については、詳細をお読みください。
  • Excelのリストで最大または最小の3つの値を合計する
  • SUM関数を使用して数値の範囲を合計することは一般的ですが、範囲内の最大または最小の3、10、またはnの数値を合計する必要がある場合があり、これは複雑な作業になる場合があります。 今日は、この問題を解決するためのいくつかの公式を紹介します。

最高のオフィス生産性向上ツール

🤖 Kutools AI アシスタント: 以下に基づいてデータ分析に革命をもたらします。 インテリジェントな実行   |  コードを生成  |  カスタム数式の作成  |  データを分析してグラフを生成する  |  Kutools関数を呼び出す...
人気の機能: 重複を検索、強調表示、または識別する   |  空白行を削除する   |  データを失わずに列またはセルを結合する   |   数式なしのラウンド ...
スーパールックアップ: 複数の基準の VLookup    複数の値の VLookup  |   複数のシートにわたる VLookup   |   ファジールックアップ ....
詳細ドロップダウン リスト: ドロップダウンリストを素早く作成する   |  依存関係のドロップダウン リスト   |  複数選択のドロップダウンリスト ....
列マネージャー: 特定の数の列を追加する  |  列の移動  |  Toggle 非表示列の表示ステータス  |  範囲と列の比較 ...
注目の機能: グリッドフォーカス   |  デザインビュー   |   ビッグフォーミュラバー    ワークブックとシートマネージャー   |  リソースライブラリ (自動テキスト)   |  日付ピッカー   |  ワークシートを組み合わせる   |  セルの暗号化/復号化    リストごとにメールを送信する   |  スーパーフィルター   |   特殊フィルター (太字/斜体/取り消し線をフィルター...) ...
上位 15 のツールセット12 テキスト ツール (テキストを追加, 文字を削除する、...)   |   50+ チャート 種類 (ガントチャート、...)   |   40+ 実用的 (誕生日に基づいて年齢を計算する、...)   |   19 挿入 ツール (QRコードを挿入, パスから画像を挿入、...)   |   12 変換 ツール (数字から言葉へ, 通貨の換算、...)   |   7 マージ&スプリット ツール (高度な結合行, 分割セル、...)   |   ... もっと

Kutools for Excel で Excel スキルを強化し、これまでにない効率を体験してください。 Kutools for Excelは、生産性を向上させ、時間を節約するための300以上の高度な機能を提供します。  最も必要な機能を入手するにはここをクリックしてください...

説明


Officeタブは、タブ付きのインターフェイスをOfficeにもたらし、作​​業をはるかに簡単にします

  • Word、Excel、PowerPointでタブ付きの編集と読み取りを有効にする、パブリッシャー、アクセス、Visioおよびプロジェクト。
  • 新しいウィンドウではなく、同じウィンドウの新しいタブで複数のドキュメントを開いて作成します。
  • 生産性を 50% 向上させ、毎日何百回もマウス クリックを減らすことができます!
Comments (39)
Rated 5 out of 5 · 1 ratings
This comment was minimized by the moderator on the site
Hi, any idea why this formula does not work: =MAX(B5,B8,B11,B14)-MIN(B5,B8,B11,B14)

=MAX(B5:B14)-MIN(B5:B14) works but I want just the four cells, not the whole range...
This comment was minimized by the moderator on the site
Hi there,

The formula should work. Is there anything wrong with the data type?

Amanda
This comment was minimized by the moderator on the site
Hi, can u help me. i got some problem on how to retrieve which outlet got lowest growth percentage since the percentage got duplicate value

for example

PEN001 -83.33%
PEN002 -83.33%
PEN003 -92.31%
PEN004 -100.00%
PEN005 -100.00%

I'm using index match min (lowest) & small (for 2nd lowest), but the result will return PEN004 for both condition which is the lowest and 2nd lowest
This comment was minimized by the moderator on the site
Hi,

To ignore the duplicate values and only count unique values, you can use the formula below:
=INDEX(A1:A6,MATCH(SMALL(IF(ISNUMBER(B1:B6),IF(ROW(B1:B6)=MATCH(B1:B6,B1:B6,0),B1:B6)),2),B1:B6,0))

In the above formula, A1:A6 is the list of PEN00N, B1:B6 is the list of percentages, 2 means to get the 2nd lowest value.
https://www.extendoffice.com/images/stories/comments/ljy-picture/2nd_unique_lowest_value.png

Note that this formula works for unique values only, which means it will only return the first value if there are duplicates.

Amanda
This comment was minimized by the moderator on the site
Cześć,

Potrzebuje poznać sposób na rozbudowanie komendy max/min by w docelowej komórce pokazywała wartość wraz z kolorem komórki.

Przykład
mam 3 dostawców z różnymi cenami tych samych produktów (produkty pionowo, dostawcy poziomo)
Dostawcy są przykładowo w kolumnach E,F,G i każdemu przydzieliłem inny kolor, który obowiązuje również ceny danego dostawcy.
W komórkach H chciałbym by pokazała się najniższa cena wraz z kolorem danego dostawcy.

dzięki!
This comment was minimized by the moderator on the site
Hi there,

Let's say the table is as shown below, you could use Excel's Conditional formatting to get the result you want:
https://www.extendoffice.com/images/stories/comments/ljy-picture/example.png

1. Enter =MIN(E1:G1,I1) in cell H1, and then copy the formula to below cells.
https://www.extendoffice.com/images/stories/comments/ljy-picture/get-min.png
2. Selet the list H1: H5, and then on the Home tab, click Conditional Formatting > New rule.
3. In the dialog box, selet Use a formula to determine which cells to format; Enter =$H1=$E1; And then click on Format to choose the background color of cell E1.
https://www.extendoffice.com/images/stories/comments/ljy-picture/create-rule.png
4. Repeat the step 3 to create rules for other background colors: =$H1=$F1 > light blue; =$H1=$G1 > light green; ...

Now, your table should look like this:
https://www.extendoffice.com/images/stories/comments/ljy-picture/result.png

Amanda
This comment was minimized by the moderator on the site
I have a table and I need to sum the columns(which I have done) then I need to find the lowest value (which I have done) how do I display the column title of the lowest value?

Thanks
This comment was minimized by the moderator on the site
Hi, could you please show me a screenshot of your data?

Amanda
This comment was minimized by the moderator on the site
Bonjour Amanda

Ca marche !!!! 😀 🤩 👌
Merci vraiment

Puis-je vous demander de nouveau votre aide ?
Voici la formule que je recherche

A1 A2 A3 A4
Chien Colibri Renard OK
Chat Renard Chien OK
Souris Chien Lion Non
Colibri Ecureuil Marmotte Non
Eléphant Colibri Chat OK

Si en A3 on retrouve les mots des colonnes A1 et A2 alors la colonne A4 indique OK
Si en A3 on ne retrouve pas les mots des colonnes A1 et A2 alors la colonne A4 indique Non

Merci encore pour votre aide très précieuse pour une débutante en excel

Bonne journée
Rated 5 out of 5
This comment was minimized by the moderator on the site
Hi, I don't quite understand why did you asign OK to the first and second rows, since I don't see that the third value is the same as the first or second one.

Amanda
This comment was minimized by the moderator on the site
Bonjour Amanda,

Je vous ai renvoyé le fichier à l'adresse mail indiquée : à l'instant

Merci encore une fois de votre aide.

Bien cordialement
This comment was minimized by the moderator on the site
Hi there,

I tried your excel file in the French enviorment, please use =IF(A1=MAX($A$1:$A$4);1;0).
The seperator should be ";" instead of "," 😅
(If the formula does not work, use SI instead of IF)

Amanda
This comment was minimized by the moderator on the site
Bonjour Amanda

Ne pouvons joindre de fichier sur le site, j'ai répondu au mail que vous m'avez envoyé et j'y ai joins le fichier excel
Vous pourrez voir ainsi que cela me mets en erreur.

Merci encore de votre aide

Bien cordialement
This comment was minimized by the moderator on the site
Hi there,

Did you send the excel file to ?
I did not receive any messages about the issue. Could you please send that again?
Also, I think the .xlsx file is supported to upload here. If you want, you can just upload it here in a comment.

Amanda
This comment was minimized by the moderator on the site
Bonjour,
En premier lieu merci pour tout ça j'y ai trouvé plein plein de soluces.
Ma question est la suivante
J'ai une colonne avec des chiffres

26.56250
25.10400
26.29101
27.66667

Et je voudrais en parallèle une formule qui va me dire non seulement le nombre le plus élevé (ça j'ai trouvé dans vos explications) mais que cette colonne indique 1 pour le chiffre le plus élevé.
Voici un exemple

26.56250 = 0
25.10400 = 0
26.29101 = 0
27.66667 = 1

Pensez-vous que cela soit possible et si oui via quelle formule ?

Je vous remercie encore et par avance en + 😄

Bien cordialement
This comment was minimized by the moderator on the site
Hi there,

Let's say the four values are in range A1:A4, you can enter the below formula in B1:
=IF(A1=MAX($A$1:$A$4),1,0)
And then drag the fill handle down to apply the formula to below cells.
https://www.extendoffice.com/images/stories/comments/ljy-picture/return-1-if-max.png

Amanda
This comment was minimized by the moderator on the site
Bonjour Amandine
Tout d'abord merci pour cette réponse.
Malheureusement cela ne fonctionne pas <font style="vertical-align: inherit;"><font style="vertical-align: inherit;">😞</font></font>

J'ai le message d'erreur habituel
Pouvez-vous m'aider encore une fois ?

Merci
This comment was minimized by the moderator on the site
Hi there,

Can tell me what error it is? I noticed that you are using French, so please try SI instead of IF: =SI(A1=MAX($A$1:$A$4),1,0)

Amanda
This comment was minimized by the moderator on the site
Good day
I have difficulty with excel and don't know the exact names of what I want but will give it a try ?

1. I have 4 Colom's A, B, C, D, =MAX()
9, 2, 4, 1,
I want a formula that include the A,B,C,D, for instance, want the formula to include the "A" and "9" as well like A9?


2 A, B, C, D,
9, 8, 9, 2,
I also need a formula for if there is 2 (or 3 or even 4) equals highs, where I can "A9" and "C9" selected as highest ?

3 base on this information how can I create an automated report for the login user once they have selected the highest value ?

4. Maybe this is not the place to ask, but how can I create a time limit for the usage of the excel workbook that expires after 30 minutes and automatically email the report
to the login user?

5. lastly the report that the user will receive is in word format

Thank you so much
Have a wonderful day
This comment was minimized by the moderator on the site
How do I write a formula to find the smallest percentage in these 3 columns and return the value as LAG Alt or GDF or DEL?
LAG ALT -5% GDF -32% DEL 28%

In example above LAG ALT is the smallest percent/Choice I would want
This comment was minimized by the moderator on the site
Hi, the value to be compared and text string have to be in two cells for excel to compre. I have wrote a formula to get the result you want: =INDEX(A2:C2,MATCH(MIN(ABS(A3:C3)),ABS(A3:C3),0)) Please refer to the screenshot to see how it works. For more details about the formula, please click the link below. I only added ABS function (to get the absolute value) to the formula listed in the article: https://www.extendoffice.com/excel/formulas/excel-get-information-corresponding-to-minimum-value.html
There are no comments posted here yet
Load More
Please leave your comments in English
Posting as Guest
×
Rate this post:
0   Characters
Suggested Locations