メインコンテンツへスキップ

Excelでプロットされた曲線の下の面積を計算する方法は?

著者: ケリー 最終更新日:2019年10月17日

積分を学習するときは、プロットされた曲線を描き、曲線の下の領域をシェーディングしてから、シェーディングセクションの領域を計算した可能性があります。 ここでは、Excelでプロットされた曲線の下の面積を計算するためのXNUMXつのソリューションを紹介します。


台形公式を使用して、プロットされた曲線の下の面積を計算します

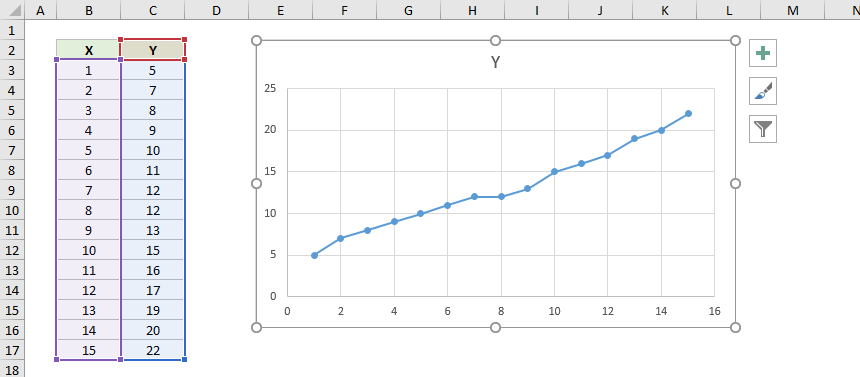
たとえば、以下のスクリーンショットに示すように、プロットされた曲線を作成しました。 この方法では、曲線とx軸の間の面積を複数の台形に分割し、すべての台形の面積を個別に計算してから、これらの面積を合計します。

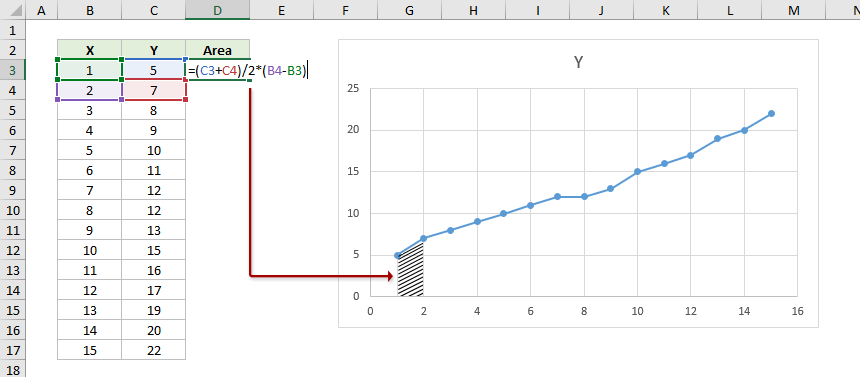
1。 以下のスクリーンショットに示すように、最初の台形は曲線の下でx = 1とx = 2の間にあります。 この式を使用すると、その面積を簡単に計算できます。  =(C3+C4)/2*(B4-B3).

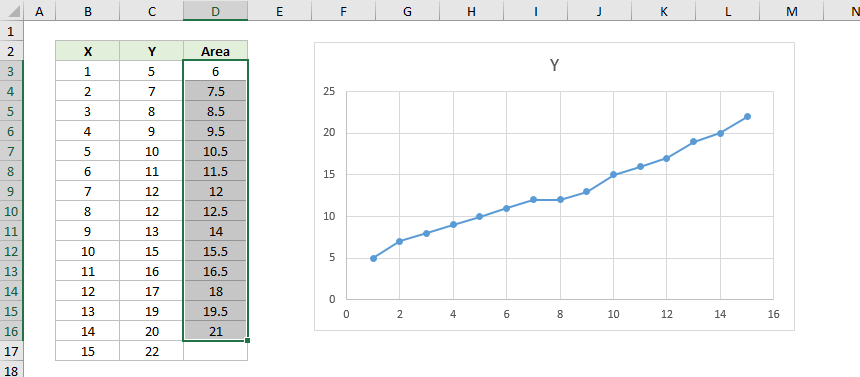
2。 次に、数式セルのオートフィルハンドルを下にドラッグして、他の台形の面積を計算できます。
Note:最後の台形は、曲線の下でx = 14からx = 15の間にあります。 したがって、以下のスクリーンショットに示すように、オートフィルハンドルを最後からXNUMX番目のセルにドラッグします。   

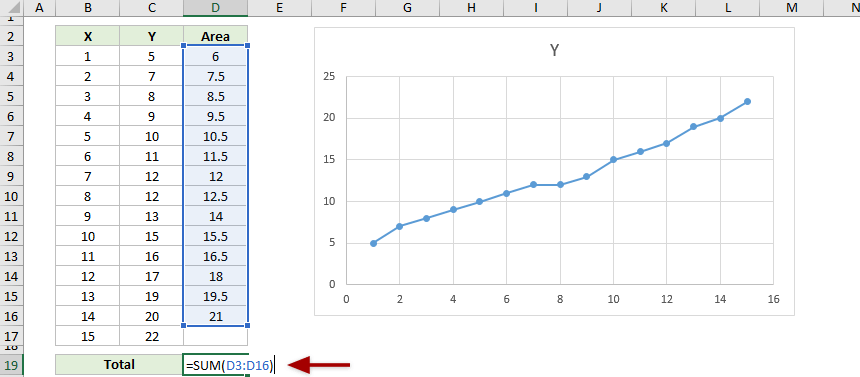
3。 これで、すべての台形の面積が計算されました。 空白のセルを選択し、数式を入力します = SUM(D3:D16) プロットされた領域の下の合計領域を取得します。

グラフの近似曲線を使用して、プロットされた曲線の下の面積を計算します

この方法では、グラフの近似曲線を使用してプロットされた曲線の方程式を取得し、方程式の定積分を使用してプロットされた曲線の下の面積を計算します。

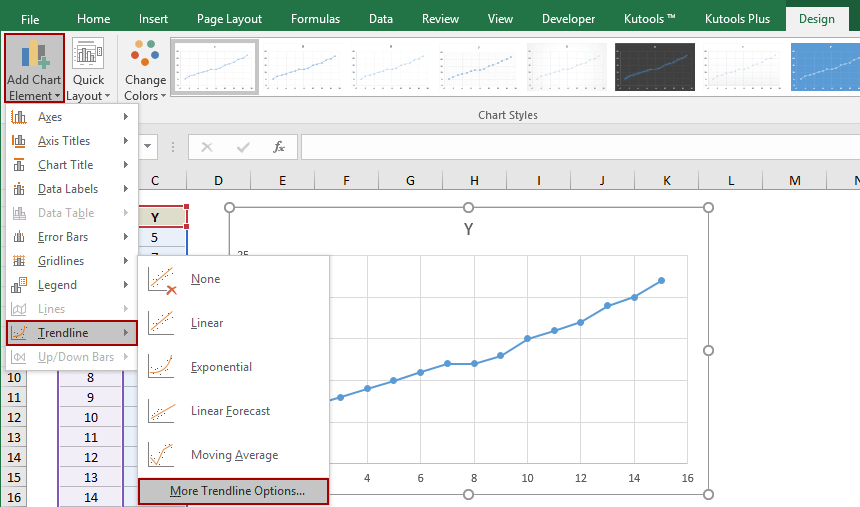
1。 プロットされたチャートを選択し、をクリックします 設計 (または チャートデザイン)> チャート要素を追加 > トレンドライン > その他のトレンドラインオプション。 スクリーンショットを参照してください:

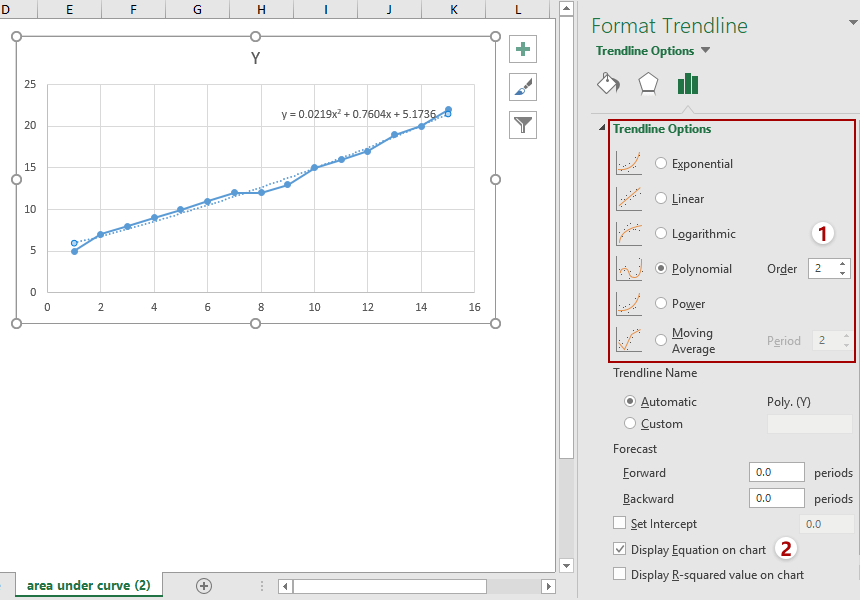
2。 の中に トレンドラインのフォーマット ペイン:
で(1) トレンドラインオプション セクションで、曲線に最も一致するオプションをXNUMXつ選択します。
(2)確認してください 方程式をグラフに表示する オプションを選択します。

3。 これで、方程式がグラフに追加されます。 方程式をワークシートにコピーしてから、方程式の定積分を取得します。

私の場合、トレンドラインで一般的な方程式は次のとおりです。 y = 0.0219x ^ 2 + 0.7604x + 5.1736したがって、その定積分は F(x) =(0.0219 / 3)x ^ 3 +(0.7604 / 2)x ^ 2 + 5.1736x + c.

4。 ここで、x = 1とx = 15を定積分に接続し、両方の計算結果の差を計算します。 差は、プロットされた曲線の下の面積を表します。
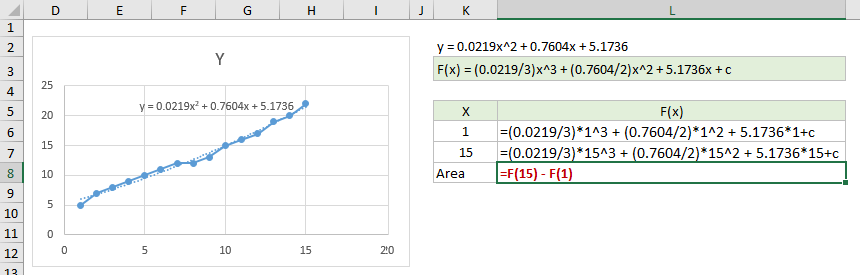
 

面積= F(15)-F(1)
Area =(0.0219/3)*15^3+(0.7604/2)*15^2+5.1736*15-(0.0219/3)*1^3-(0.7604/2)*1^2-5.1736*1
面積= 182.225


関連記事:

最高のオフィス生産性向上ツール

🤖 Kutools AI アシスタント: 以下に基づいてデータ分析に革命をもたらします。 インテリジェントな実行   |  コードを生成  |  カスタム数式の作成  |  データを分析してグラフを生成する  |  Kutools関数を呼び出す...
人気の機能: 重複を検索、強調表示、または識別する   |  空白行を削除する   |  データを失わずに列またはセルを結合する   |   数式なしのラウンド ...
スーパールックアップ: 複数の基準の VLookup    複数の値の VLookup  |   複数のシートにわたる VLookup   |   ファジールックアップ ....
詳細ドロップダウン リスト: ドロップダウンリストを素早く作成する   |  依存関係のドロップダウン リスト   |  複数選択のドロップダウンリスト ....
列マネージャー: 特定の数の列を追加する  |  列の移動  |  Toggle 非表示列の表示ステータス  |  範囲と列の比較 ...
注目の機能: グリッドフォーカス   |  デザインビュー   |   ビッグフォーミュラバー    ワークブックとシートマネージャー   |  リソースライブラリ (自動テキスト)   |  日付ピッカー   |  ワークシートを組み合わせる   |  セルの暗号化/復号化    リストごとにメールを送信する   |  スーパーフィルター   |   特殊フィルター (太字/斜体/取り消し線をフィルター...) ...
上位 15 のツールセット12 テキスト ツール (テキストを追加, 文字を削除する、...)   |   50+ チャート 種類 (ガントチャート、...)   |   40+ 実用的 (誕生日に基づいて年齢を計算する、...)   |   19 挿入 ツール (QRコードを挿入, パスから画像を挿入、...)   |   12 変換 ツール (数字から言葉へ, 通貨の換算、...)   |   7 マージ&スプリット ツール (高度な結合行, 分割セル、...)   |   ... もっと

Kutools for Excel で Excel スキルを強化し、これまでにない効率を体験してください。 Kutools for Excelは、生産性を向上させ、時間を節約するための300以上の高度な機能を提供します。  最も必要な機能を入手するにはここをクリックしてください...

説明


Officeタブは、タブ付きのインターフェイスをOfficeにもたらし、作​​業をはるかに簡単にします

  • Word、Excel、PowerPointでタブ付きの編集と読み取りを有効にする、パブリッシャー、アクセス、Visioおよびプロジェクト。
  • 新しいウィンドウではなく、同じウィンドウの新しいタブで複数のドキュメントを開いて作成します。
  • 生産性を 50% 向上させ、毎日何百回もマウス クリックを減らすことができます!
Comments (9)
No ratings yet. Be the first to rate!
This comment was minimized by the moderator on the site
Danke für das Tutorial,

ich habe ein Verständnisproblem zum bestimmten Integral.
1. warum ist in der Formel das "c" und warum verschwindet es beim Einsetzen wieder?
2. wenn ich 1 und 15 in meine Formel einfüge, sind dies doch lediglich die Werte der X Achse. Also meine Messpunkte aber nicht meine Messwerte. Die "echten" Werte meines Diagrams sind die auf der Y-Achse und diese werden doch dann nicht berücksichtigt, oder?
This comment was minimized by the moderator on the site
Bonjour,
Pourriez-vous m'expliquer à quoi corresponds le petit "c" en fin d'équation de F(x) ?
Merci beaucoup !
This comment was minimized by the moderator on the site
Wie kommen Sie von der Trendlinie zum bestimmten Integral?

Sie beschreiben, dass ich die Gleichung der Trendlinie in das Arbeitsblatt kopieren soll. Wie soll das funktionieren?

Kopieren Sie die Gleichung in Ihr Arbeitsblatt und erhalten Sie dann das bestimmte Integral der Gleichung.
In meinem Fall lautet die allgemeine Gleichung nach Trendlinie y = 0.0219x ^ 2 + 0.7604x + 5.1736daher ist sein bestimmtes Integral F (x) = (0.0219 / 3) x ^ 3 + (0.7604 / 2) x ^ 2 + 5.1736x + c.
This comment was minimized by the moderator on the site
Ik heb een dataplot waarbij de waardes van de X-as variëren tussen negatieve en positieve waardes.
Bv -80 tot +80. Als ik daarbij deze regels volg, maak ik denk ik een fout tussen de 2 data punten op de overgang van positief naar negatief, aangezien ik som een negatieve oppervlak onder de curve uitkom, zowel met trapezium als met integraal methode.
Ik ken het kruispunt (x=0) niet altijd, dus kan de grafiek niet in 2 stukken opsplitsen.
Kunnen jullie me helpen hoe ik dit best aanpak?

Thx!
Sofie
This comment was minimized by the moderator on the site
Thank you for explaining.. I learned the same, that I did not know before. really helps me a lot.RegardsDebashis
This comment was minimized by the moderator on the site
The formula for the trapezoid rule should be =((C3+C4)/2)*(B4-B3) instead of =(C3+C4)/2*(B4-B3). Otherwise you will divide C3+C4 by 2*(B4-B3), instead of multiplying (C3+C4)/2 by (B4-B3)
This comment was minimized by the moderator on the site
Hi Bas,
Actually the formula will be calculated just like what it's like when you do mathematical operation. It makes no difference if you add the additional brackets to (C3+C4)/2 or not. Unless you add the brackets this way: (C3+C4)/(2*(B4-B3)), then it will divide C3+C4 by 2*(B4-B3).
Anyway, thanks for your feedback. If you have any other questions, please don't hesitate to let me know. :)
Amanda
This comment was minimized by the moderator on the site
You are correct, my apologies. I was under the assumption that multiplication had precedence over division, as I learned in school many years ago, but apparently that rule changed almost 30 years ago and I only now became aware of that. Well, better late than never, so thank you for correcting me.
This comment was minimized by the moderator on the site
You are welcome Bas, and I do feel happy for you gaining one more little knowledge here :)
There are no comments posted here yet
Please leave your comments in English
Posting as Guest
×
Rate this post:
0   Characters
Suggested Locations